Étiquette : mobility (Page 2 of 8)

Community Mobility Reports

“ As global communities respond to COVID-19, we’ve heard from public health officials that the same type of aggregated, anonymized insights we use in products such as Google Maps could be helpful as they make critical decisions to combat COVID-19. These Community Mobility Reports aim to provide insights into what has changed in response to policies aimed at combating COVID-19. The reports chart movement trends over time by geography, across different categories of places such as retail and recreation, groceries and pharmacies, parks, transit stations, workplaces, and residential. ”

Source : COVID-19 Community Mobility Reports

Staying at Home During Coronavirus Is a Luxury

“Although people in all income groups are moving less than they did before the crisis, wealthier people are staying home the most, especially during the workweek. Not only that, but in nearly every state, they began doing so days before the poor, giving them a head start on social distancing as the virus spread, according to aggregated data from the location analysis company Cuebiq, which tracks about 15 million cellphone users nationwide daily.”

Source : Location Data Says It All: Staying at Home During Coronavirus Is a Luxury – The New York Times

“Last week Buzzfeed News and the Los Angeles Times featured street-level visualizations of how COVID-19 is affecting traffic patterns in major cities around the world. The visualizations were generated from Mapbox Traffic data. For this post, we dug further into our telemetry data to show how much and where movement and local travel patterns have changed around the globe during the COVID-19 pandemic.”

Source : Where and when local travel decreased from COVID-19 around the world

A graphic with no description

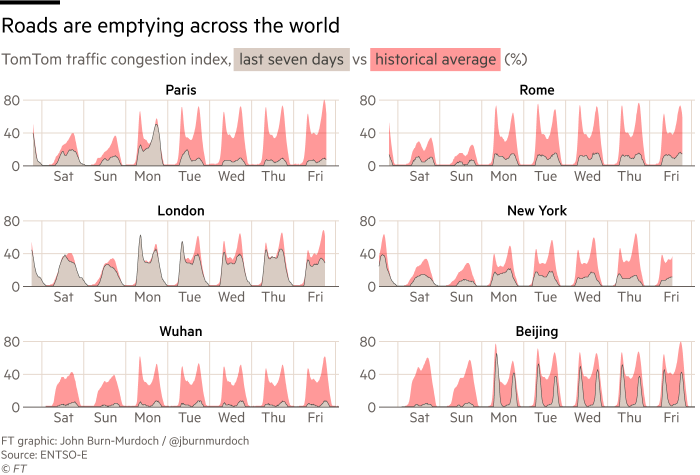
“A group of former IMF chief economists warned last weekend that a global recession had already begun, but although economic activity is slowing sharply, much official data are out of date before they are even published, given the time they take to collate.  To make up for the lack of official information, the FT has compiled a set of alternative, high-frequency measures of economic activity for different sectors which give an early indication of what to expect when official data start to become available in the coming weeks. ”

Source : Real-time data show virus’s hit to global economic activity | Financial Times

Et si Facebook n’était qu’un malentendu…

“Augmented and virtual reality are about delivering a sense of presence — the feeling that you’re right there with another person or in another place. Instead of having devices that take us away from the people around us, the next platform will help us be more present with each other and will help the technology get out of the way. Even though some of the early devices seem clunky, I think these will be the most human and social technology platforms anyone has built yet.
The ability to be « present » anywhere will also help us address some of the biggest social issues of our day — like ballooning housing costs and inequality of opportunity by geography. Today, many people feel like they have to move to cities because that’s where the jobs are. But there isn’t enough housing in many cities, so housing costs are skyrocketing while quality of living is decreasing. Imagine if you could live anywhere you chose and access any job anywhere else. If we deliver on what we’re building, this should be much closer to reality by 2030.”

From : Mark Zuckerberg – Facebook

“Quand on a commencé notre installation de feux tricolores à des endroits bizarres, les médias ont commencé à s’intéresser à notre histoire. J’ai alors réussi à entrer en contact avec un cartographe indépendant, qui travaille bénévolement pour Waze. Ensemble, on a cherché des solutions. Il m’a dit qu’on ne pouvait effectivement pas changer grand-chose à l’algorithme, mais qu’on pouvait le tromper un peu en ajoutant des paramètres. Il a d’abord changé des voiries de catégorie. Sur Waze, il y a différentes catégories de routes, qui vont de la catégorie 1, les autoroutes, à la catégorie 6, de petites routes résidentielles. On a passé des routes en catégorie 6 et depuis, on a effectivement un peu moins de flux. Le centre de Lieusaint. Une autre mesure efficace, ça a été de sélectionner d’autres trajets que ceux passant par Lieusaint comme étant des trajets « attractifs ». Dès le lendemain, on en mesurait les effets. Au total, on a réussi à réduire le trafic de 40 à 50 % environ. Ce n’est pas réglé pour autant, alors on prévoit encore d’ajouter sur la carte des équipements publics comme les écoles, afin que l’algorithme se « dise » : ok, on va éviter les flux massifs dans le coin”.

Source : « On a mis un feu rouge improbable à l’entrée de la ville » : les astuces du maire de Lieusaint pour tromper Waze – Tech – Numerama

“Today, we’re taking the next step in our journey with the introduction of our commercial self-driving service, Waymo One. We’ll first offer Waymo One to hundreds of early riders who have already been using our technology. Over time, we hope to make Waymo One available to even more members of the public as we add vehicles and drive in more places. Self-driving technology is new to many, so we’re proceeding carefully with the comfort and convenience of our riders in mind. At first, Waymo-trained drivers will supervise our Waymo One vehicles. ”

Source : Waymo One: The next step on our self-driving journey

« Older posts Newer posts »

© 2025 no-Flux

Theme by Anders NorenUp ↑