How is the world connected? The Global Language network shows connections among language groups that are expressed in Book Translations, Tweets and Wikipedia edits.
Source : Global Language Network
How is the world connected? The Global Language network shows connections among language groups that are expressed in Book Translations, Tweets and Wikipedia edits.
Source : Global Language Network

heatmap.js is a lightweight, easy to use JavaScript library to help you visualize your three dimensional data!
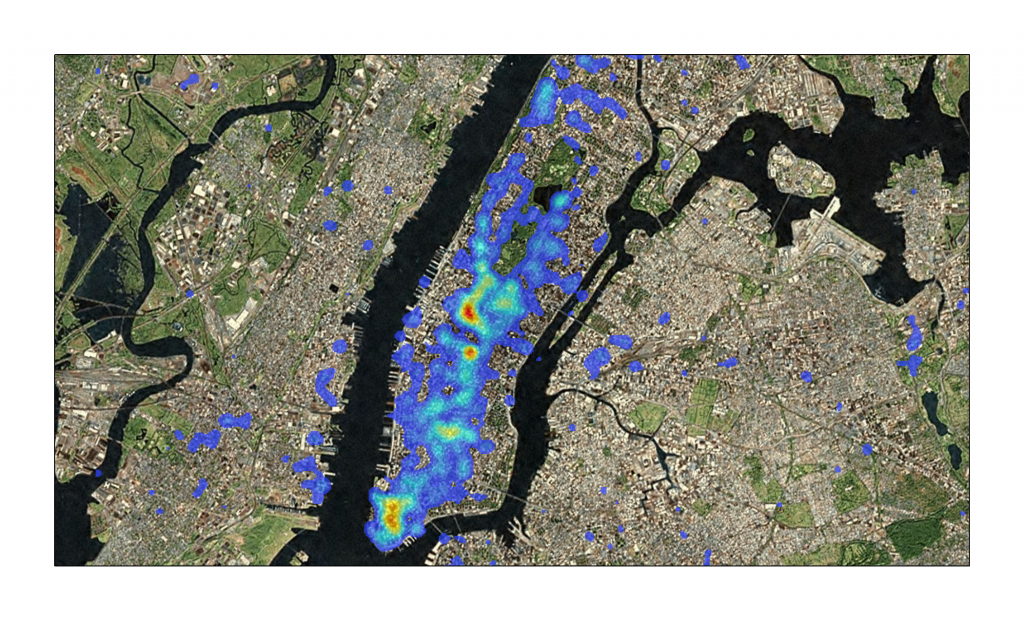
There are many ways to gauge importance from a social and cultural sense, such as calculating the centrality of the Salt Lake City Airport in a network made up of world airports, or measuring the number and type of notable individuals a city produces. We struggle with just such a question of metrics all the time in the digital humanities, and so I’ve experimented with several more off-the-wall measures. One that I think provides a sense of cultural density, especially in the English-speaking world, is a measure of the quantity of Wikipedia articles associated with a place. It’s very rough, and meant to be one of the ever-useful “gestures” at meaning that are used in the humanities (while the sciences have perfected the proxy, the gesture is truly the most valuable humanities commodity).

Taha Yasseri of the Oxford Internet Institute and colleagues looked at Wikipedia’s different language editions from their inception (January 2001 for English) to March 2010 and ranked the most contested articles, based on the number of reverts and the number of edits the contributors have made (dubbed their “maturity score”). The results in some ways confirm cultural stereotypes. Americans bicker over politics and professional wrestling; among the top French squabbles is Freud.

“Histography » is interactive timeline that spans across 14 billion years of history, from the Big Bang to 2015.The site draws historical events from Wikipedia and self-updates daily with new recorded events.The interface allows for users to view between decades to millions of years.The viewer can choose to watch a variety of events which have happened in a particular period or to target a specific event in time. For example you can look at the past century within the categories of war and inventions.Histography was created as a final project in Bezalel Academy of Arts and Design. Guided by Ronel Mor – histography.io
Source : Histography – Matan Stauber
Terra Incognita visualises how Wikipedia has evolved over the last decade as an intriguing mirror of cultural and sociological difference.
Source : TraceMedia – Terra Incognita
The editors object to Geshuri’s involvement in a high-profile « no poach » agreement between several large tech companies. In that deal, companies agreed not to « cold call » each others’ workers. In 2010, the Department of Justice said the arrangement—which applied to Google, Apple, Adobe, Intuit, Intel, and Pixar, among others—violated antitrust law.
Source : Wikipedia editors revolt, vote “no confidence” in newest board member | Ars Technica

Les médias nous donnent-ils une vision déformée du monde qui nous entoure ? La question est vieille comme Théophraste Renaudot, mais j’ai tenté d’y apporter une réponse moderne avec une série de cartes ‘anamorphosées’.
Source : Voici comment les médias français voient le monde | Dans mon labo
The attack comes five weeks after Ukraine’s power grid was successfully disrupted in what’s believed to be the world’s first-known hacker-caused power outage. Researchers still aren’t sure if the malware known as BlackEnergy was the direct cause of the blackout, but they have confirmed the malicious package infected at least three of the regional power authorities that were involved in the outage. Researchers have since said the attack was extremely well coordinated.
Source : Israel’s electric authority hit by “severe” hack attack (Updated) | Ars Technica
© 2026 no-Flux
Theme by Anders Noren — Up ↑